Flood Risk Days
KPI 1
Precipitation above 25mm
Snow Days
KPI 2
Days with Snow on Ground
Extreme Heat
KPI 3
Days with Temp > 30C
Extreme Heat/Humid
KPI 4
Humidex > 40
Severe Cold
KPI 5
Days with Temp < -20
Severe Cold with Wind
KPI 6
Days with Windchill below -30C
Extreme Cold with Wind
KPI 7
Days with Windchill below -40C
Air Quality Risk
KPI 8
Days with Air Quality Index >4
Severe Air Quality Risk
KPI 9
Days with Air Quality Index >7
Data Source: weatherstats.ca
Our Adaptation Initiatives
The community inventory data is tracked annually to evaluate performance towards the emissions reduction targets. These targets are measured against the baseline year.
Tree Canopy Key Metrics
Tree Canopy Coverage
KPI 10
Impervious Surfaces
KPI 11
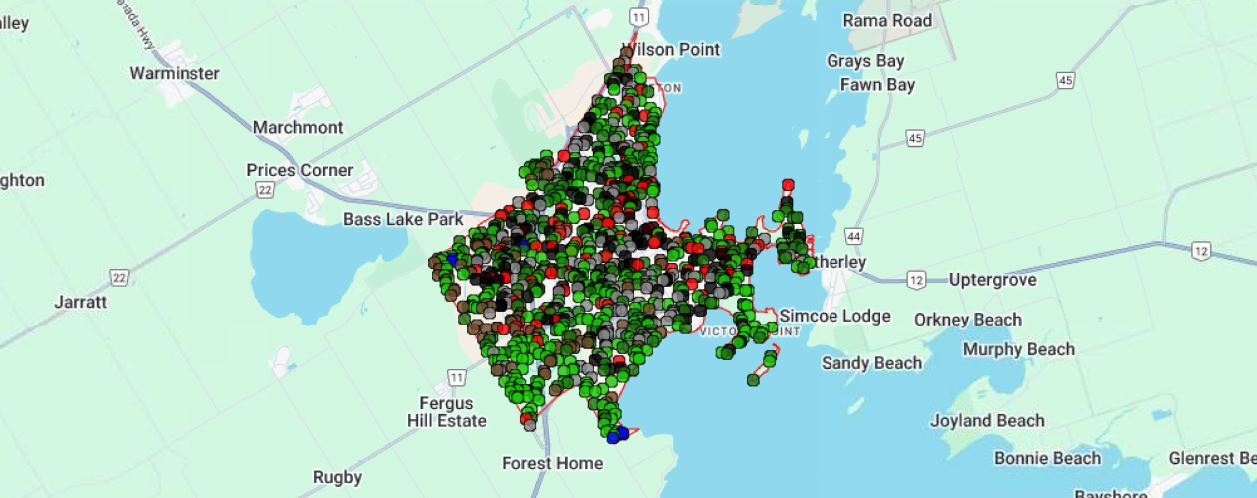
Land Cover Chart
Land Cover Sampling Map
Land Cover Distribution Table
| Land Cover Category | Percentage |
|---|
| Grass/Herbaceous | |
| Impervious Buildings | |
| Impervious Other | |
| Impervious Road | |
| Soil/Bare Ground | |
| Tree/Shrub | |
| Water | |
Tree Canopy Benefits
Carbon Sequestered
286
Annually (TCO2e)
Total Carbon Stored
9561
(TCO2e)
Avoided Runoff
355
Megaliters
Commmunity Tree Initiatives